Data Modeling for the Rest of Us: Making entity data easier to understand
Why don't we start the data modeling discussion by putting entities front and center? It's one way to force the question of "why does this matter?" Everything Starts Out Looking Like a Toy, #127

Hi, I’m Greg 👋! I write essays on product development. Some key topics for me are system “handshakes”, the expectations for workflow, and the jobs we expect data to do. This all started when I tried to define What is Data Operations?
This week’s toy: a browser game that’s a little bit tetris, a little bit 2048, and mostly just an amusing way to spend a few minutes. Don’t be surprised if it teaches you a little bit about strategy and thinking beyond the immediate next move. Edition 127 of this newsletter is here - it’s January 9, 2023.
The Big Idea
A short long-form essay about data things
⚙️ Data Modeling for the Rest Of Us

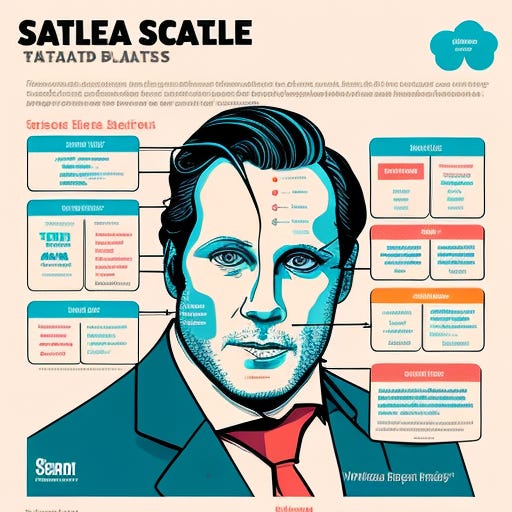
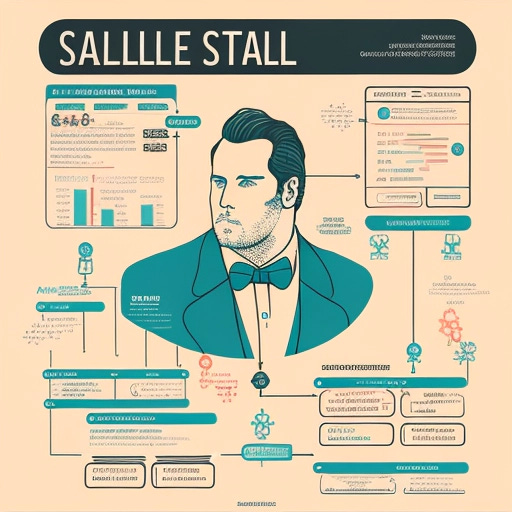
If AI-driven image prompts could create an effective data model for business users to describe the data inside their organizations and identify key metrics that they wanted to track, it might look like the slightly insane diagram generated above. A magical process like this might also determine if metrics were based on counting entity data or contingent on events that happen in an environment.
As data professionals, we don’t always have a simple way to explain entity data, metrics, and events to the “typical” business user. “It depends” is a familiar term when talking about a data problem, finally coalescing on a technical definition that we memorialize with a SQL query or a very specific data definition language helping us to create relationships between data objects.
We don’t have a simple process to make data modeling easier for the average business stakeholder, but maybe we need to have one, especially when the discussion of data modeling looks like the confused faces you see on the other side of a Zoom call.

Begin with the End in Mind: how do we do business?
A perfect conversation that ends in a proper data model (like the movie posters above that magically align some bubbles that look like they make sense, but actually need critical detail) starts with a few assumptions about the way the company does business.
What are the entities that make up the key parts of that business?
When we talk about an entity, we mean a thing in the business that we want to model in data. For most businesses, this starts with thinking about:
People - customers, leads, contacts, and employees that represent the people of the business. You might want to model a person as a single entity, use multiple entities to represent different kinds of people, or identify the key transitions that change people attributes.
For example, what’s the moment when you know a lead becomes a contact associated with an account that is a customer? This probably happens after a sale and implies that most people need to be associated with a company.Companies - the businesses we try to sell to as we run our business. Companies are related to people (they can’t exist very well without them) and have their own set of particular attributes.
You might want to differentiate between companies of different sizes because this informs your sales motion and how you engage with various types of companies.Business-specific items - the unique items that you manage in your business. Whether you have a digital-first or a physical business, these are the atomic units of your business. Just like an Airline has planes, reservations, tickets, and destinations, your business has its specific lingo for the items you manage.
At the most basic level, to model data, it helps to think about the items you would want to count or the events you would want to capture. If you have a business that creates project management software, you might measure tasks created, tasks completed, tasks abandoned, the number of tasks in a project, and the number of people assigned to a task.
We do business by identifying key events that happen to actors or items in our environment that help us make decisions about what to do next. Data modeling should reinforce this conversation and give us decision support to take action.
A First Modeling Discussion
Here’s one way to think about modeling data if you’ve never tried it before.
The first time you imagine the model, you’ll need to start by defining the list of things you care about.
As we reviewed above, you’ll probably start with types of data like:
People - a general repository for people data
Leads - information about people who have expressed sales interest and aren’t yet customers
Contacts - People at companies who purchase from you
Companies - a general repository for company data
Accounts - Companies who buy from you
and specific entities to map to business goals in your environment
Each one of these items represents a set of data that you need to define to organize this information in your company’s systems.
What do you need to know about an entity?
This diagram shows one way to enter the conversation about data modeling, from the initial identification of entities through the relatedness of entities to one another to the metrics you’ll use to track things.
Entities consist of some basic attributes:
Name
Description
Attributes or fields
A date when the schema (this list metadata) was last updated
Any relationships to other entities, and information whether that is a one-to-one, one-to-many, or many-to-many relation
For example, your “Person” entity might be as simple as adding these fields: first name, last name, email, PersonID, persontype, companyId, datecreated, and lastupdated. However, you could easily add more fields.
Once you know which fields are in your entity, you need to know:
Where does this data come from?
Is there a particular system that is the best source of this data in your organization? For example, Salesforce might be the best source of contact data in your organization, as it’s confirmed by sellers during the sales engagement process. However, your billing system might be the best source of the company address if you send them a physical bill.
How often do you need to check this information? Many attributes don’t change all that often; others like email decay quickly.
How is this data related to other entities? A contact has a company relationship that is many-to-one, implying that for every contact that exists, you need to have a company record
How will you know the uniqueness of this information, and which of these fields are required to be filled?
Understanding the basic schema and metadata of your entity gives you a good headstart to have other conversations about the relation of your data in your system.
Extending the conversation to talk about metrics
Now that you’ve thought about entities and how to relate to other entity data, let’s talk about how to think about metrics in context.
Metrics use counting of entity or event data, bounded by conditions and a time schedule, to create numbers to compare.
Here’s a simple diagram to set up a metric. You need to think about which items are involved, the conditions or constraints that limit the number of records you are counting, and how often you need to count this metric.
Simple metrics involve counting items.
How many customers do we have?
How many people visited the home page this week?
As you identify events that matter (a completed meeting, a login in your application), you may want to consider more complicated ideas:
Of the people who started an application flow, how many completed that flow within 60 minutes?
When people take this action in our system, do we want to contact them?
The combination of metrics happening in a specific time period with a specific entity field change represents a trigger for action. It’s the key business question you want to answer when modeling. When the opportunity status becomes closed-won, what needs to happen in the business so that we can welcome a new customer?
2nd order (and more interesting) metrics happen when you start chaining trigger events in patterns and tying them to specific entities. When this happens often enough, you start gathering data that could be used for predictive decisions.
Applying metrics to action
Metrics in a vacuum are just numbers you count. These definitions need to be shared with the whole organization so that anyone who needs to understand what’s being measured and who owns that result can go to one place to find it. Without agreement from the team, you’ve got siloed numbers.
One way to drive agreement and provide a living reference is a metrics catalog. This could be as simple as a spreadsheet that lists the top priorities of the organization, or it could be tracked by a more sophisticated system, listing:
What metrics do we care about
Who owns them
Their definition
Where to find it and how to calculate it
The iterative process might look something like this:
The act of counting items or ratios to drive business decisions is the key reason that we model data. By defining the rules of engagement for the business and writing out how they happen, we make it a lot easier to discuss changes and understand how to materialize metrics in reports, dashboards, and alerts.
What’s the takeaway? Data modeling may sound like an esoteric topic. It’s a key task that we need to do as we create and run our business to clarify the most important metrics we track. Creating a decision log (and definitions) of our business objectives makes it easier to know whether we are doing well or not.
Links for Reading and Sharing
These are links that caught my 👀
1/ What makes up customer data? - Arpit Choudary proposes a new definition for customer data inclusive of things customers provide and things we capture about them. What’s interesting about this is that it opens up the idea of segmenting customer data more fully into things they know they shared and other things we inferred. Take a look:
2/ An open-source data catalog - Chris Riccomini has released Recap, a “data catalog for people who hate data catalogs.” It’s exciting to see tooling being created to help developers discover, work with, and document metadata about the data infrastructures where they work. It will undoubtedly help application users to learn more about the data they are using, too.
3/ A reminder to combat fear with action - I love this essay by Amy Hoy on replacing fear with fun. You can’t change the things that are scary out in the world, and you can try to change the way you respond to fear.
What to do next
Hit reply if you’ve got links to share, data stories, or want to say hello.
Want more essays? Read on Data Operations or other writings at gregmeyer.com.
The next big thing always starts out being dismissed as a “toy.” - Chris Dixon


