

Estimate your pipeline with Google Sheets
At the beginning of the month or quarter, how do you estimate your path to the goal? A spreadsheet can help. Read: "Everything Starts Out Looking Like a Toy" #188

Hi, I’m Greg 👋! I write weekly product essays, including system “handshakes”, the expectations for workflow, and the jobs to be done for data. What is Data Operations? was the first post in the series.
This week’s toy: if your Delorean is in need of a tool to convert lightning into 1.2 gigawatts of power for time travel, don’t look at O’Reilly Auto Parts. Edition 188 of this newsletter is here - it’s March 4, 2024.

Brought to you by Apollo.io, an all-in-one solution providing RevOps teams with access to data, enrichment, outreach, call intelligence, scoring, calendaring, and email automation. They integrate seamlessly with your CRM and existing workflows. The quality of Apollo’s data is unmatched; they are ranked #1 for contact and company data accuracy on G2 with over 6000 reviews and a 4.8 star rating.
If you have a comment or are interested in sponsoring, hit reply.
The Big Idea
A short long-form essay about data things
⚙️ Estimate your pipeline with Google Sheets

It’s the beginning of the month, and the same conversation happens at the beginning of every month, quarter, or year: “how’s the pipeline?”
Pipeline is a tricky thing. I’ve heard it described persuasively as a bathtub where the level of pipeline (water) rises and falls as deals enter (leads) and leave (closed lost or won). That means it’s changing over time and difficult to see the rate of change on a day. But everyone pays attention at the beginning and end of the period.
The end results are pretty easy to measure. Did you make your new logo, MRR, SQL, and MQL targets? The beginning of the period is not quite as easy to estimate. Dear SDR Managers, Sales Leaders, and Ops Pros, I made this Google Sheet for you.
A tool to learn more about the inputs to pipeline
Pipeline is all anyone wants to hear about in the sales management process. We do a great job focusing on individual deals and don’t always focus on the input activity that results in outcomes that are closer to what we want.
Pipeline growth comes down to a few things.
Are you working each deal fully enough and quickly enough, while not hanging on to failed deals for too long? Do you have enough volume to make your number? And do your conversion rates support the number of leads you’re getting?
One common challenge I’ve seen working with sales teams and ops pros is the ability to look at what we have and estimate what we will need to do to make the goal. I made the Google sheets template to make it easy to plug in your various ratios (lead-to-MQL, MQL-to-SQL, SQL-to-win) and your deal goals (new revenue, average size deal, number of logos).

The yellow boxes in the model represent numbers to change, while the blue boxes indicate outputs from that model.
Combine this information with the number of reps, you’ll have a quick ratio of the number of deals they handle. Specify the percentage of reps who make quota and you’ll see a result that suggests you do or do not have enough pipeline. (Hot tip: expecting all reps to make quota is probably a misapplied assumption).
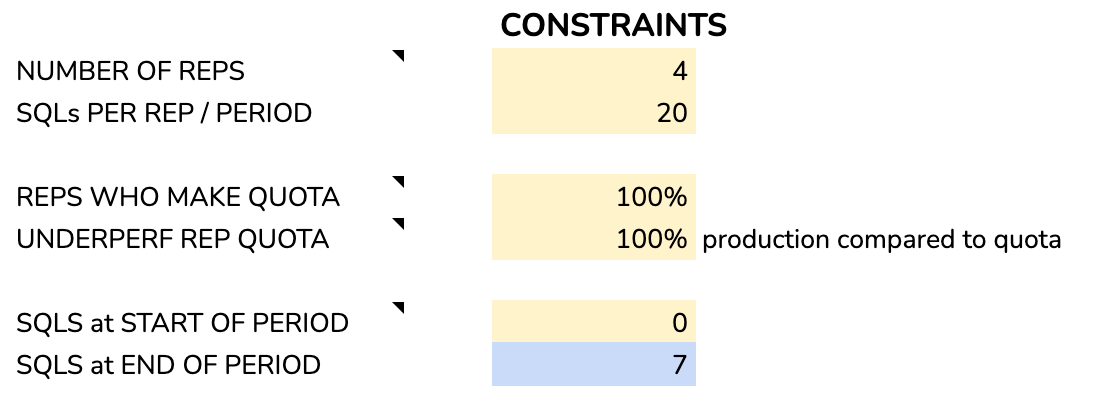
You can also specify if you start the month with pipeline added from the previous month.
What does this tool tell you about your pipeline?
This tool is not going to replace your forecasting efforts. It will give you an idea of where your model has rough edges. Think of it as an early warning system for not having enough deals, consuming too many deals, not being resilient enough to handle when conversion rates change, or when reps don’t make their number.

When you use this Sheet, play with the variables to see how the outputs change for the model. With the number of leads you get and your success rate, does it help you more to improve your closing rate or to raise the average revenue per account? If you add another salesperson, do you have enough deals to source your SQLs for that person?
With this sheet, you will be better able to get a sense of whether you are succeeding or not in the early part of a period. Estimating during the period is especially important at the beginning of the period because salespeople are tired and they haven’t switched from closing mode to business development.
If you consider Parkinson’s law, the duration of bureaucratic work expands to fill the available time. If don’t point out the pipeline gap early in a period, people might not notice until it’s crunch time. Use a tool like this one to find the surprises early - and you’ll have enough time to react.
Let me know if you have suggestions for this tool, or if you have requests for Google Sheets revops templates.
What’s the takeaway? “Pipeline management” sounds like a wonky term, but a big chunk of the effort is making sure that the activity and results that are happening translate into the expected results for the organization. Using simple spreadsheet models helps the team react to changing conditions and create sensitivity analysis for the possible outcomes.
Links for Reading and Sharing
These are links that caught my 👀
1/ Time zones are hard - In two weeks, we will have gone through leap year and the change between standard time and daylight saving time. When programming with time, what could possibly go wrong? Here are a few things to consider.
2/ Making better data visuals - If you’re comparing line graphs, you might want to display them side by side instead of as an overlay. This is a pretty interesting take on how to show like series of data in one place.
3/ Do this right, and get a tip - Cajoling ChatGPT might work, especially if you tell it to do its job … or else. Max Woolf examines whether offering the carrot or the stick in your instructions changes the distribution of the result set offered by OpenAI.
What to do next
Hit reply if you’ve got links to share, data stories, or want to say hello.
Want to book a discovery call to talk about how we can work together?
The next big thing always starts out being dismissed as a “toy.” - Chris Dixon