Hi, I’m Greg 👋! I’ve written almost 100 essays on product, data, and process where I noodle on an idea or a future product direction, often data that exists between systems.
We don’t talk enough about system “handshakes”, the expectations for workflow, and the jobs we expect data to do. Read more: What is Data Operations?
This week’s toy: Michael Jackson’s Billie Jean, played by a bunch of hard drives. I ❤️ that the sounds of early PCs are still being used, albeit in an entirely new way. The 99th edition of this newsletter is here - it’s June 27, 2022.
The Big Idea
A short long-form essay about data things
⚙️ Make your data product more than a feature

What is a data product and what do people expect from it? Today, people think of data products as the outputs of complex systems like data warehouses, data lakes, or custom software. By matching data sets in those resources with technologies that enable the use of those data sets to solve a problem, the data product produces exactly the right output to solve that problem.
That’s exactly the wrong way to think about things. Once the problem you’re solving changes, the use-case specific implementation of a feature on top of a technology on top of a storage mechanism gets really brittle. Do you build an entirely new solution to solve the next problem and store it in another data puddle in your data lake? Data products are products because they deliver a dependable outcome and value, even if the underlying structure and content of the data changes slightly (or drastically) over time.
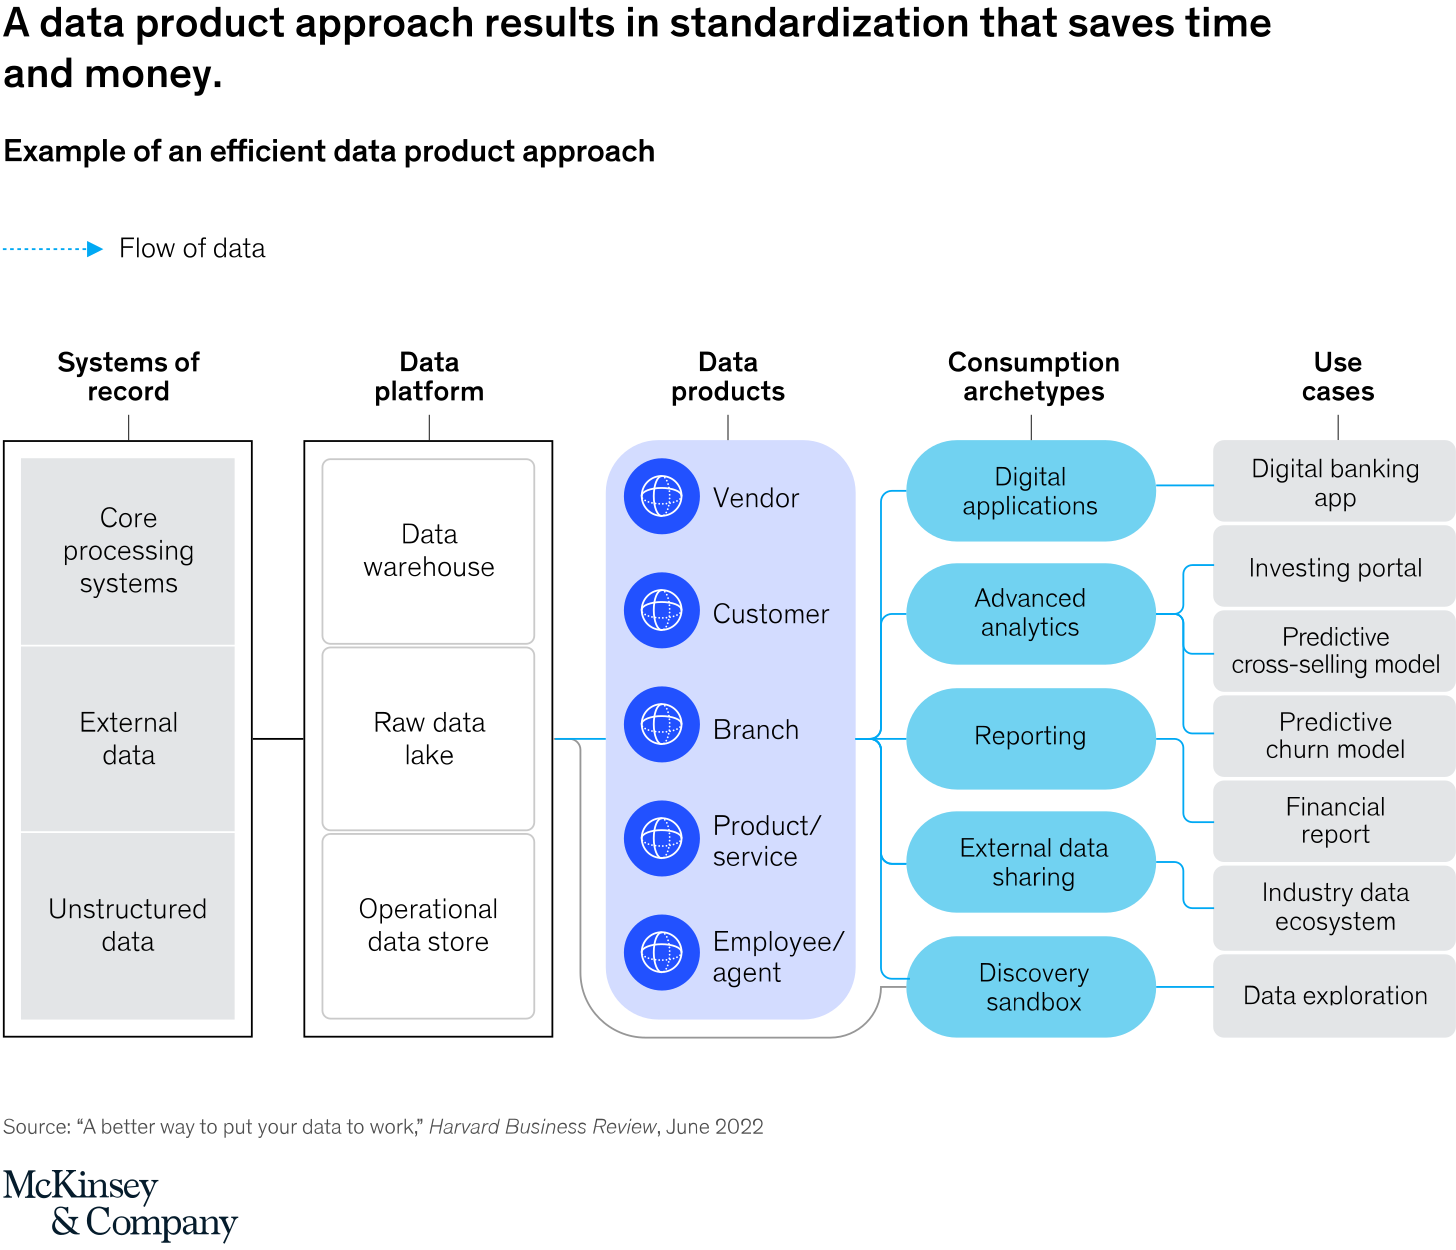
A product is more than a feature that delivers momentary benefits for the current use case. And doing it this way is valuable. In the recent article “How to unlock the full value of data? Manage it like a product”, the strategy firm McKinsey writes: “[c]ompanies that treat data like a product can reduce the time it takes to implement it in new use cases by as much as 90%.” (HBR, emphasis mine)
Expecting change as a platform
What should we request from our data products? Here are a few suggestions.
Data products…
Deliver a repeatable, reliable, and accurate result
Are built on a foundation (platform) that enables extension and insight
Are not impossible to understand
The first job of any data product is the same use case as a feature: delivering reliable (and interesting) data in a consumable form to the subscribers that need that data. An example of data feature might be producing an hourly report of the temperature of a key location, aggregating a marketing report of daily leads, or recommending the next 10 accounts a seller should approach. You need to provide new and updated data, while protecting the feature from breaking if underlying information changes in the environment.
So what if the user of the feature wants to change an important item about the use case? Changing the location of temperature collection, suggesting different filters on lead sources, or updating the number of recommended accounts or the scoring algorithm are simple examples of updating inputs to the feature. And now comes the importance of building on a common base. And of making things interoperable.
As you get more use cases for the same data, you start to build metrics that might tell you interesting things about the data. Building your product like a series of disconnected features will not get you to that outcome. The interconnectedness of the features and of the data is not guaranteed unless you build it in from the start.
It all sounds smart, but might not work together
We all want to sound smart. We want our data products to produce amazing data. But they are not valuable unless they produce valuable outcomes that help the business make decisions based on insights from that data.
A data product has to be more than just a feature that you dream up because a department thinks it would be a good idea to have an additional report or a new view on things. A data product (think about the underlying meaning here, we want the word product to literally mean the multiplier between items) must be based on a common platform that produces insights. To create this outcome, we need a unified data model describing entities that relate to other entities in the data model.
In McKinsey’s version of this story, they describe the platform as literally the platform that stores the data. A missing item in the illustration below is the interconnectedness necessary between data products. The base items at the core of an information relationship are people, locations, and objects, in addition to digital links that combine the things. You can’t have a customer or a vendor without having a person, so you need to model an environment that supports weird exceptions like someone performing both roles.

Building a foundation for Insights
Let’s imagine that we’re going to do this right. We build a true platform for our data product, and have an idea of how all of this should work together. Our individual features are interoperable or comparable, and support the idea of data exploration to learn more than just the reports we produce about the specific use cases our features answer.
As a data product owner, one of our goals is to produce “actionable insights.”
Roughly speaking:
An Insight is more than just data. It’s “[a] penetrating observation about human behavior that results in seeing consumers from a fresh perspective.” or “[a] discovery about the underlying motivations that drive people’s actions.” (Thrive Thinking)
The idea of “actionable” means that data must drive action. Without a reason to do something based on the information delivered by our data product, what’s the point?
So, what do we need to make our data actionable? The folks at Data Robot have summarized it this way:
These are great concepts to discuss the idea of an actionable data insight, and also of accurate and relevant data more generally. Great insights answer all of these questions and dimensions to live up to the promise of being an actionable insight. (SPOILER: they are interrelated.)
Relevance - is this data related to the problem I’m trying to solve or question I need to answer?
Context - how do I understand what this data means when related to other data, in order of magnitude or impact?
Specificity - can I use this information point back to a set of data, or is it not related at a low enough level to be relevant?
Clarity - reading this insight, does it make sense at first glance or do I need to learn much more to understand what it means?
Alignment - how do I use this information and is it congruent with other forms of analysis?
You’re recognizing a theme in these concepts: they reinforce each other. All of these measurements require a platform enabling information to be compared to other information in your product. To understand if something is aligned, relevant, or to deliver context, you need to compare it to something else. To deliver specificity, clarity, and alignment, data in one area of the product needs to be calibrated with other areas of the product.
Why is Data Product more than a feature?
Features deliver a momentary benefit that might be significant, but doesn’t necessarily relate to other, like items of data. A feature that allows you to export an image of a data report is useful. But a platform that allows you to enable that feature for any data report implies a platform architecture offering services that span features and make it possible for you to reinforce a product experience in more places.
Products and platforms make it possible to extend the data product into new areas while letting each item stand on its own.
What’s the takeaway? Resist the urge to build disconnected data features. The hallmark of a data product is the interoperability of information across schemas and entities to enable true insights. These are additive and novel observations, not just rehashing and aggregating existing reports. Insights are not possible without an underlying platform that aligns, activates, and validates the data.
Links for Reading and Sharing
These are links that caught my 👀
1/ How long is a nanosecond? - Admiral Grace Hopper explains. The next time you are speaking with a developer about a delay in a system or process you will have a vivid new analogy to consider. And if ms are that much longer than ns, getting rid of seconds in your process really hits home.
2/ Markdown for time series - creating a series of labels with accompanying information presents a unique information design challenge. Do you create rows and rows of data, adding columns to indicate optional information? Do you write out exhaustive lists of information at each series point? One interesting solution is to use a form of markdown to identify points in time and the things that happen. The result looks a lot like a Gantt chart or another kind of timeline, and is more accessible than your average Asana chart.
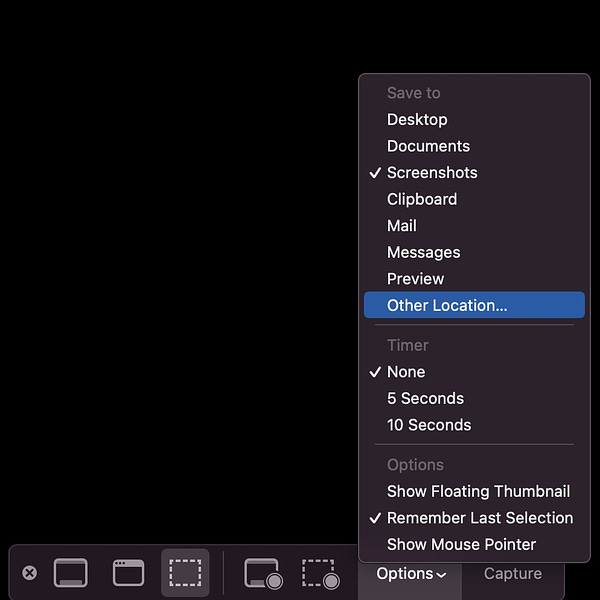
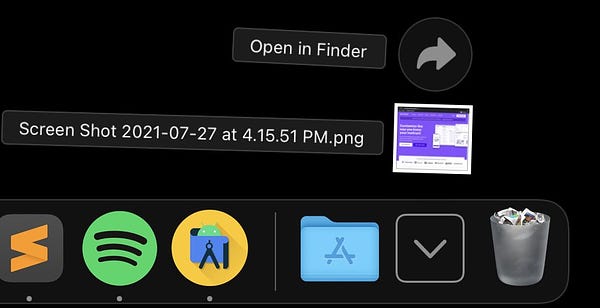
3/ A way to clean up screenshot cruft - Sal Testa has some clever tricks to make your Mac screenshots better. This was my favorite: setting a default folder to catch all of the junk that normally ends up on the desktop.


What to do next
Hit reply if you’ve got links to share, data stories, or want to say hello.
I’m grateful you read this far. Thank you. If you found this useful, consider sharing with a friend.
Want more essays? Read on Data Operations or other writings at gregmeyer.com.
The next big thing always starts out being dismissed as a “toy.” - Chris Dixon


