


Request for product: an embeddable timeline widget
One of the most important views of the customer is a time-series of everything that has happened. Why are embeddable timelines so hard to find? Read: "Everything Starts Out Looking Like a Toy" #243


Hi, I’m Greg 👋! I write weekly product essays, including system “handshakes”, the expectations for workflow, and the jobs to be done for data. What is Data Operations? was the first post in the series.
This week’s toy: a new format of “interactive movies” allows the audience to vote on key story points in a movie using an app and a QR Code. This seems brilliant and horrible simultaneously, like allowing the visiting team’s fans to sit in the home section at your stadium during a sporting event. Ultimately, theaters and moviemakers should love it, because it encourages multiple screenings. Will moviegoers like it? Check back in a few years. Edition 243 of this newsletter is here - it’s March 24, 2025.
Thanks for reading! Let me know if there’s a topic you’d like me to cover.
The Big Idea
A short long-form essay about data things
⚙️ Request for product: an embeddable timeline widget
One of the biggest challenges to obtaining a full view of the customer is that the system you are viewing probably doesn’t have access to the important milestones of a customer and their current state.
Imagine that you are in a typical SaaS business, and you go to look at a customer’s sales history in your CRM. Whether Salesforce, Hubspot, or another system, you depend on an external process or automation to place tasks in the timeline to represent changes in that customer’s history or sentiment.
Now think about how that same customer appears in a case management system like Zendesk or Front or Pylon. It *might* be possible to install an app or an embeddable iframe, but one thing that’s missing is a native primitive for the timeline. I have seen this feature in Kustomer, but it’s not readily adopted elsewhere as a standard.
We live in a time-series, event-driven world
You might have opened this essay and thought: “who cares about another widget? I want to know what’s happening with my customers wherever they are in the customer journey.” Yes, exactly.
Consider these ideas:
Every customer engages with your company across multiple systems
These interactions happen over time
No one system has a “full view of the customer” – you might have an internal application that has a complete set of states, but it doesn’t capture everything outside of your application – so that view of the customer is distributed across systems and time
That means that some system visualizes or constructs the timeline for the other systems to know the proper history of a customer. It’s not enough to have that information in a data lake somewhere because each department that serves the customer needs that detail.
Whether we’re zooming in on the typical events of a prospect, the comprehensive list of important things that happen to a customer, or the metadata around that customer’s communication with your team, the information is in many places.
The fix is to create an information timeline object with the necessary facts to show you relevant customer facts wherever it’s installed in your systems.
This product idea depends upon securing information by role, place, and attribute. It also presumes you will follow safeguards and that it’s possible to create a secured internal method to send and retrieve information about a customer from an internal system to another internal system.
Why an event timeline for each customer?
Timelines are a pretty simple concept. As time goes by, events happen. In today’s world where there’s so much stuff going on, it’s comforting to have a ledger as a customer where you can visually see a representation of what’s happened (YOU ARE HERE📍).
As a company, you want to appear as one voice to the customer, and they (typically) want to engage with the fewest people possible to solve their problem or start something new. The customer also often wants to see a subset of the same information you would see in a timeline - a method of communication that raises trust.
A time series lets take a snapshot of attributes for a customer or group of customers and measure the changes from that point in time, illustrating a way to quantify improvement (or lack of improvement) in an area of the business.
Each system is a contract with the internal customer
In a “distributed system of truth” where individual systems maintain their version of the overlapping truth, the system is interdependent and loosely coupled. Each member of the system is responsible for reporting:
its area of responsibility (Sales, Service, Application, etc)
what it knows about the customer
how to match the central ID of the customer to the local information in that system
adding context for a time series
If this works correctly, you’ll be able to know what’s happening with the customer and each system can add events since you’ve known the customer.
The output? A “golden record” that combines what you know today with the lineage of how that information changes over time and the ability to go back to “snapshots” at relevant points in the past.
What would that component look like?
Here’s a brief description of that component - I think it’s a missing piece in the market. If you search you can find lots of instances of “timeline”, but many are not easily styleable with modern techniques.
We’d want:
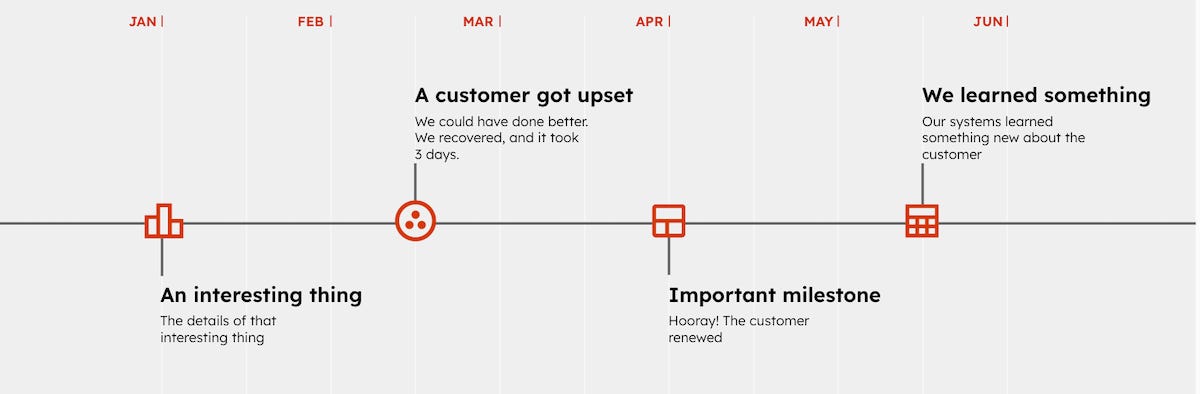
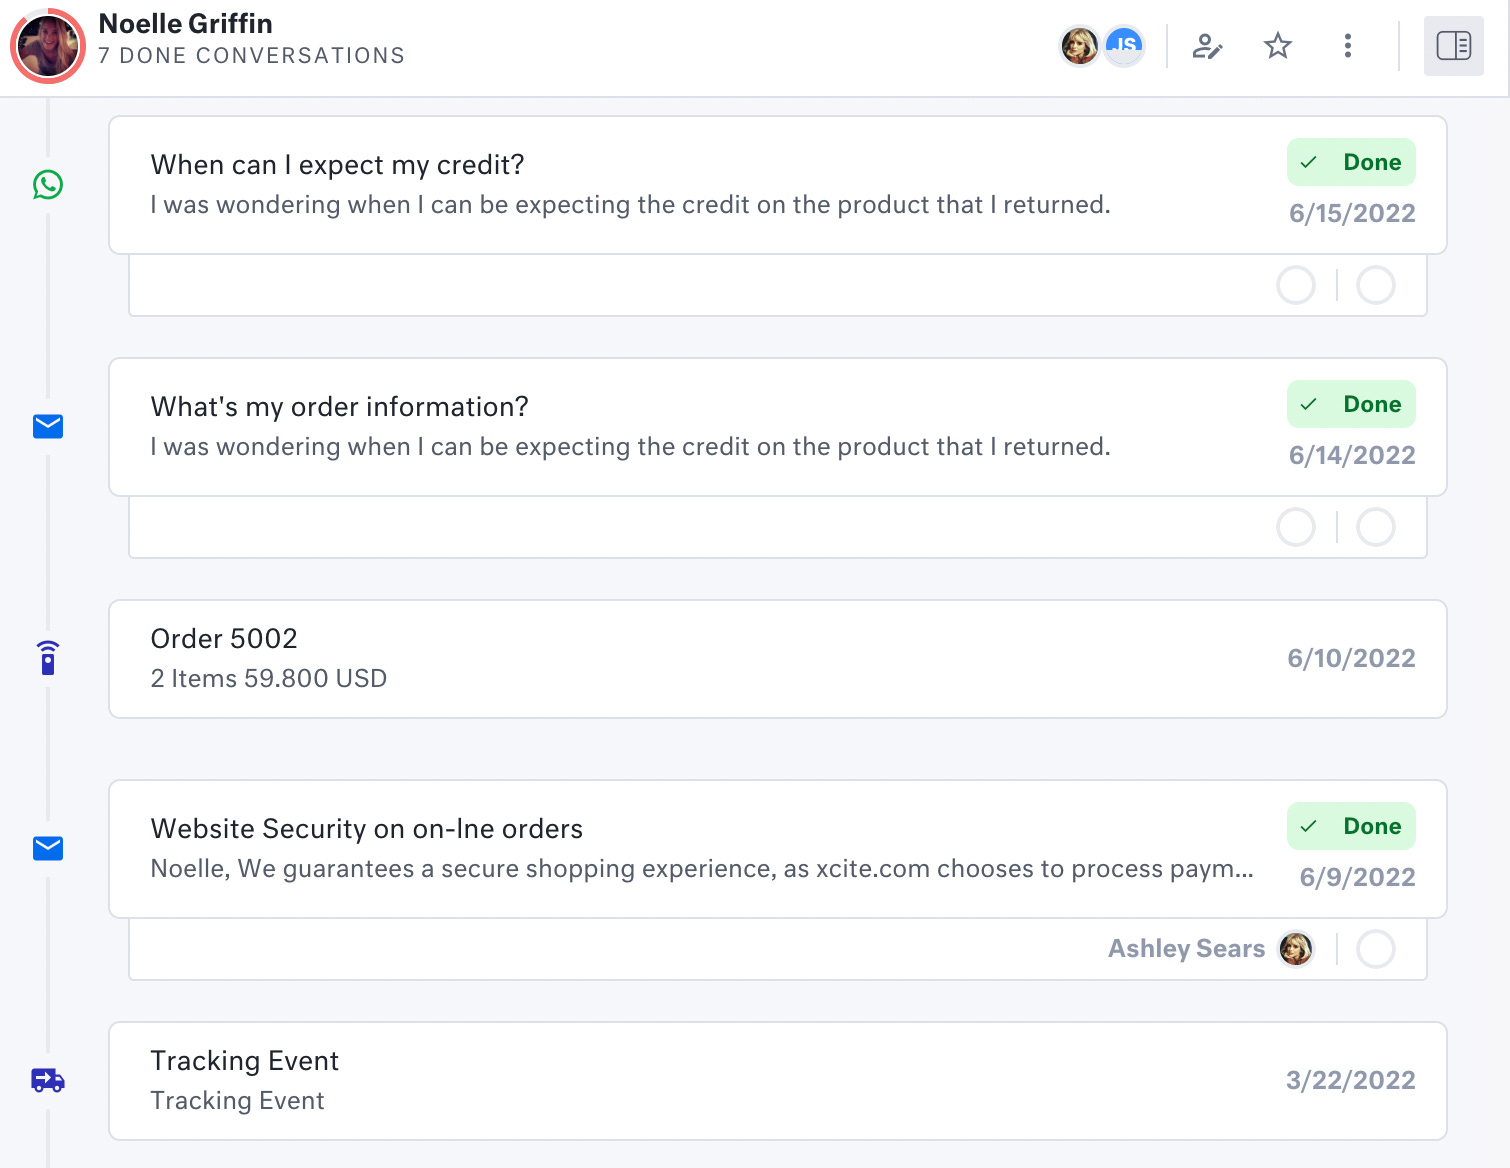
A timeline component that can be rendered in both horizontal and vertical orientations
Each node on the timeline represents an event or milestone, showing a concise summary (title, date, short description) by default
When a user interacts with (e.g., clicks or hovers over) a node, it expands or reveals additional details or interactive elements
The component must handle time-series data and display it in a visually clear sequence, accommodating varied date ranges and data density
Key considerations include responsive design, modular styling, and easy data binding to support diverse use cases
It’s got to be secure and decoupled from supply-chain dependencies
Here are some additional requirements:
Functional Requirements:
Data Structure: Accepts a standardized format (e.g., array of objects with
date,title,summary,details, etc.)Interaction: Mouse or touch events that expand or collapse node details; possibly tooltips or popovers
Responsive Design: Adjusts layout for various screen sizes (mobile, tablet, desktop)
Performance: Efficient rendering even with large data sets; lazy loading or virtualization for many events
Technical Constraints & Considerations:
Front-End Framework: Should be framework-agnostic or easily adaptable to common libraries (React, Angular, Vue)
Accessibility: Keyboard navigation and screen-reader support (ARIA labels, focus states)
Animation & Transitions: Smooth transitions for expand/collapse, with minimal performance overhead
Documentation & Examples: Clear usage examples, code snippets, and styling guidelines
It’s easy to make a basic timeline, and a challenging design problem to create a beautiful time series that flexibly shows a customer’s history across different systems and interactions. That timeline needs to be filtered quickly, retrieve information securely, and be independent of outdated technology.
It should also be a joy to use. Have you seen a plugin like this one?
What’s the takeaway? The typical customer view is lacking because it doesn’t have a way to represent the “golden record” of accurate data at a point in time for a customer. One way to do this is to visualize that data in a timeline component that beautifully demonstrates the customer journey through good and bad events. We need more ways to do this.
Links for Reading and Sharing
These are links that caught my 👀
1/ Getting data out of PDFs - It’s easy to think that “talk to a document” apps or features are as simple as loading a PDF and asking questions to a ChatBot (p.s. don’t do this with confidential or personal data unless you’re hosting a local, well-controlled model). It turns out that there are many things about text in PDFs that make them challenging to load and view. PDFs were never intended to be structured information available in any format to any system. Instead, they were a convenient way to provide a universal viewer for any optically captured output.
2/ There be AI dragons - This is a great list of common problems that show up in AI coding. (There are helpful suggestions here too to avoid these problems.) Like other programming “black boxes” you might not know well, a few good rules include “don’t trust anything” and “force the system to explain to you what’s doing” and “keep the units small so they are easy to test.”
3/ Thinking in Loops - If you haven’t tried to work with AI agents and you’re not sure how to start, here’s an easy framing: think of them as linked loops. It’s similar to how you would interact with people, where first you hand some work to a person who does one role, then to another person with another job to check the work.
What to do next
Hit reply if you’ve got links to share, data stories, or want to say hello.
The next big thing always starts out being dismissed as a “toy.” - Chris Dixon